

“Momento óptimo para los mercados emergentes”
Richard Turnill, Director Mundial de Estrategia de Inversión en BlackRock - Viernes, 29 de Abril


Nos encontramos en un momento óptimo para los activos emergentes. Apreciamos oportunidades específicas en esta clase de activos ya que, por ahora, los obstáculos se han disipado. Ha sido una semana positiva para los activos emergentes, ya que el dólar estadounidense alcanzó su nivel mínimo de los últimos seis meses y Argentina volvió a los mercados de renta fija. Contemplamos la posibilidad de que los activos emergentes sigan registrando un mejor comportamiento, aunque podrían darse problemas estructurales más adelante
***
Key Points
-
1 We are in a sweet spot for emerging market (EM) assets. We see selected opportunities, as key headwinds have abated for now.
-
2 EM assets had a strong week as the U.S. dollar retested a six-month low and Argentina returned to bond markets.
-
3 We see a window for EM assets to further outperform, but structural challenges could come to the fore later this year.
|
1 AN EM SWEET SPOT FOR NOW |
|
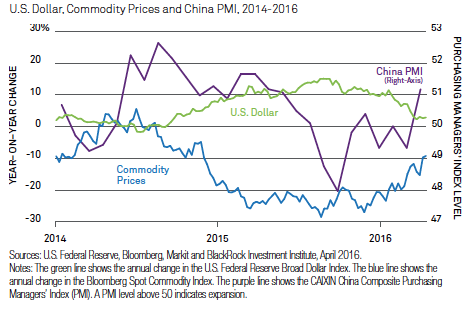
We are in a sweet spot for EM assets. The chart below shows how key headwinds for EM assets have abated lately, with a weakening U.S. dollar, a rebound in commodity prices and a recovering Chinese economy. CHART OF THE WEEK U.S. Dollar, Commodity Prices and China PMI, 2014-2016 30% 20 10 0 -10 -20 -30 2014 U.S. Dollar China PMI (Right-Axis) 2016 53 52 51 50 49 48 47 Commodity Prices 2015 Sources: U.S. Federal Reserve, Bloomberg, Markit and BlackRock Investment Institute, April 2016. The Federal Reserve (Fed) has signaled it is set to keep rates on hold for now. This has lowered the near-term risk of EM capital outflows, weakened the U.S. dollar and boosted oversold EM currencies. China’s foreign reserves rose in March for the first time in five months. Also supporting EMs: firming oil prices, fading global recession fears and signs China’s economy may enjoy a cyclical rebound. |
YEAR-ON-YEAR CHANGE
PURCHASING MANAGERS’ INDEX LEVEL
Can the sweet spot get sweeter?
EM-related exchange traded products (ETPs) have attracted nearly $16 billion this year, according to BlackRock research. EM ETPs have recouped 75% of their 2015 outflows, the “short EM” trade is much less crowded than it was at the start of the year, and EM valuations are no longer unambiguously cheap, our research suggests.
Fed tightening, a Chinese yuan devaluation or economic slowdown, and a renewed slump in oil prices are all risks to the EM story. We see the Fed remaining dovish through mid-year. Yet risks could return in the second half as U.S. rates increase and China’s credit-fueled growth improvement slows.
What would it take to get a sustained EM bull market? We would need to see evidence of structural reforms addressing excess debt, industrial overcapacity and low corporate profitability, particularly in China. Policies currently supporting Chinese growth are actually increasing structural imbalances.
We see value in EM currencies such as the Mexican peso. We generally favor EM local currency debt (especially in Brazil and Indonesia) over U.S. dollar debt. EM central bank rate cuts amid lower inflation should support many local rates markets. In equities we like India, given a nearing peak in the bad loan cycle, Mexico on structural reforms, and China based on near-term growth prospects.
|
2 WEEK IN REVIEW |
GLOBAL SNAPSHOT Weekly and 12-month performance of selected assets U.S. Large Caps Emerging Asia Ex Japan Brent Crude Oil Gold 2.2% U.S. Treasuries 1.9% 1.5% U.S. TIPS 1.9% 3.3% U.S. Investment Grade 3.2% 3.4% U.S. High Yield 7.6% 2.3% U.S. Municipals 1.9% 2.8% Non-U.S. Developed 0.7% 2.8% Emerging Market $ Bonds 5.7% -28.1% Euro/USD 4.6% 3.9% USD/Yen -6.8% -14.9% Pound/USD -4.2% EQUITIES WEEK 12 MONTHS -8.0% DIV.YIELD BONDS WEEK 0.5% 1.4% 1.4% 1.2% -10.6% -0.1% 12 MONTHS YIELD -0.8% 2.1% -0.4% 0.1% 1.7% 1.3% -8.4% 1.1% -1.9% 1.1% -6.7% -0.1% 4.6% -0.1% -17.3% -1.0% 6.1% -0.2% -17.4% 0.1% 3.9% COMMODITIES WEEK 12 MONTHS CURRENCIES WEEK 12 MONTHS 4.7% -0.5% -0.1% 2.8% 4.6% 1.4% Source: Bloomberg. As of April 22, 2016. Notes: Weekly data through Friday. Equity and bond performance are measured in total index returns in U.S. dollars. U.S large caps are represented |
|
3 WEEK AHEAD |
|
April 27 April 28 April 29 April 30 Federal Open Market Committee (FOMC) meeting and rate announcement First-quarter U.S. gross domestic product (GDP), Bank of Japan (BoJ) statement on monetary policy U.S. Employment Cost Index, Eurozone Consumer Price Index (CPI) China official PMI data U.S. growth has been just right: strong enough to moderate global slowdown concerns, yet not so strong that it raises expectations of rapid Fed rate increases and dollar appreciation. This week may provide clues about how long U.S. growth and monetary policy will remain in this sweet spot for EM assets. We don’t expect the Fed to raise rates this week, but the central bank’s comments may shed some light on whether we’ll still see one or two rate increases this year. If the U.S. first- quarter GDP report comes in stronger than expected, the Fed may not be able to remain on hold much longer. Elsewhere, expectations for further policy change from the BoJ have been increasing given recent yen strength. Official China PMI data will likely show continued improvement, confirming the EM sweet spot can continue in the near term. |
ASSET CLASS VIEWS
Views from a U.S. dollar perspective over a three-month horizon
EQUITIES
Overweight
ASSET CLASS
VIEW
COMMENTS
U.S.
▲
The U.S. consumer and housing sectors are strong, and growth appears to be stabilizing. We see peak margins and payout ratios limiting returns, however.
Europe
▲
Reasonable valuations and ECB policy are supportive, but weak growth and a challenged banking system are risks. Domestic U.K. equities look vulnerable to Brexit fears.
Japan
—
Positives are relative value and improving corporate governance. Yet much is priced in, progress on structural reforms is slow, and the BoJ may have reached its limits in weakening the yen.
EM
—
Structural challenges such as excess debt persist. Yet we see value for long-term investors. An expected slower pace of Fed rate increases is a positive.
Asia ex-Japan
—
Long-term headwinds persist as imbalances are unwound. While we view Chinese devaluation as unlikely, the tail risk remains. We prefer India.
U.S. Treasuries
▼
Improving data are a short-term risk. Long bonds have a structural bid amid low rates and are portfolio diversi ers, but vulnerable to upticks in in ation in the short run.
U.S. Municipals
▲
We like relatively attractive (tax-exempt) yields and low volatility. We see potential for in ows after recent strong performance.
U.S. Credit
—
We generally prefer U.S. high yield over investment grade. Higher yields offer better compensation for risks such as rising corporate leverage.
DM ex-U.S. Fixed Income
▲
Both sovereigns and credit outside the U.S. are underpinned by very easy monetary policies. Slowing Fed normalization is checking the dollar’s rise, supporting returns on non-USD bonds.
EM Debt
—
We lean toward local-currency EM debt. Currencies have adjusted, yields have risen to attractive levels, and the U.S. dollar has slowed its appreciation trend.
Commodities
—
Commodity markets are oversupplied and sensitive to downward global growth revisions. A strategic allocation to gold makes sense for diversi cation.
FIXED INCOME
Underweight
COMMODITIES
Neutral
▲ Overweight — Neutral ▼ Underweight
[Volver]
- No compres lo que no entiendes
- MERCADOS:los beneficios o pérdidas empresariales de ayer no sirven para nada
- El efectivo sigue siendo ampliamente utilizado en la zona del euro por personas de diversos orígenes, incluso aquellos con tarjetas de pago y cuentas bancarias
- “Por cada dólar invertido en combustibles fósiles, se están invirtiendo actualmente $1,7 en energías limpias”
- Los valores cíclicos y defensivos son indicadores fiables del sentimiento de los inversores
- “La relación crecimiento/valor de Estados Unidos está poniendo a prueba una resistencia a largo plazo”
- MERCADOS:los beneficios o pérdidas empresariales de ayer no sirven para nada
- “La relación crecimiento/valor de Estados Unidos está poniendo a prueba una resistencia a largo plazo”
- No compres lo que no entiendes
- El efectivo sigue siendo ampliamente utilizado en la zona del euro por personas de diversos orígenes, incluso aquellos con tarjetas de pago y cuentas bancarias
- Los países del Golfo dirigiendo sus inversiones a minería
- Los valores cíclicos y defensivos son indicadores fiables del sentimiento de los inversores
- BOLSA:“Un genio que pierde el control de sus emociones puede ser un desastre financiero. Lo opuesto también es cierto”